Its Tuesday, we just had a tough week, hand up. We are currently sitting on 7-7-2 Week with our model winner predictions.
Our ML Predictions which had gone from 81% come back to reality of 70%. Over the last two weeks we had added O/U projections to the app that have had 63% accuracy. Which is a good silver lining to have, but we know, you want winners, we want winners. We all want winners.
Now let me preface this, our current model is NOT our final model. This is actually the first year we have suggested picks for Weeks 1-5.
We do not do official picks until Week 6, why? Because of what just happened Week 3.
The first 5 weeks of the NFL season are when teams find themselves, every year NFL teams change so much the predicting Weeks 1-5 is notoriously risky.
Did we go 81% in predicting Week 1 and 2? Yes. Did that make us get a little over confident based on the early success of our current model performance? Definitely.
So what happened Week 3? Chaos. Major upsets, major changes, and more importantly, much more to learn from.
This losing week is a gift, we needed it. Why? Because now we can better understand why we did well Weeks 1 & 2, and what we can identify what lead to the poor performance in Week 3.
And where do we look? Win Probabilities.
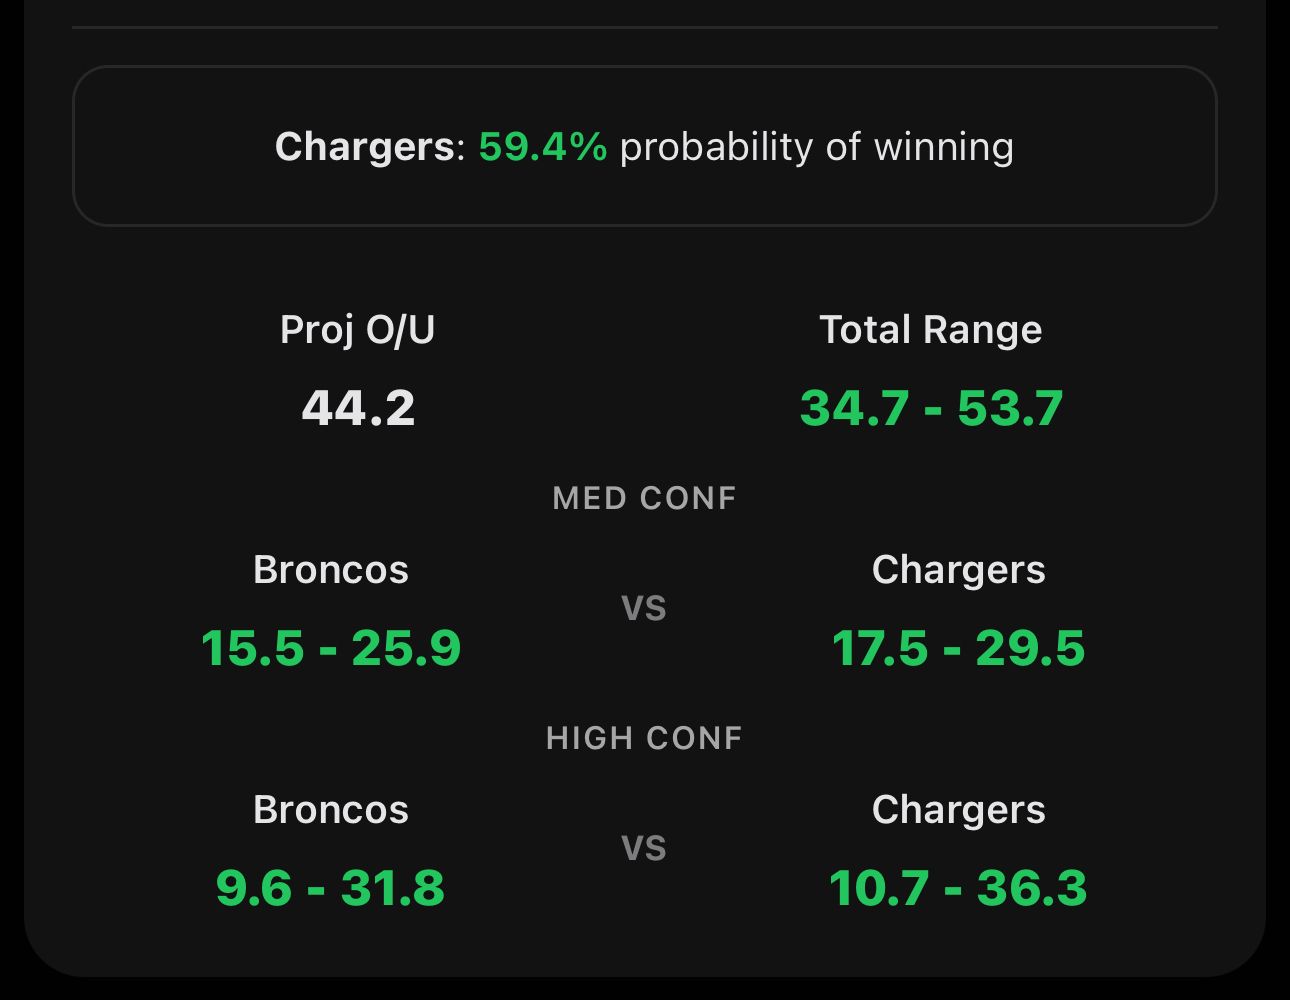
Chargers vs Broncos Week 3
We put out an app update with each match up’s Win Probabilities, and if you are a pro member it would have given you insights to more carefully bet this week.
Now lets take a look at the Win Probabilities distribution between Week 1, 2, and 3.
Week 1 (12-4) Win Probability Distribution
We went 75% week 1 with our picks, for an opening week that is great. Out of the 16 games, 14 games had a team with a win probability of 60% or higher. Below is a breakdown of the win probabilities.
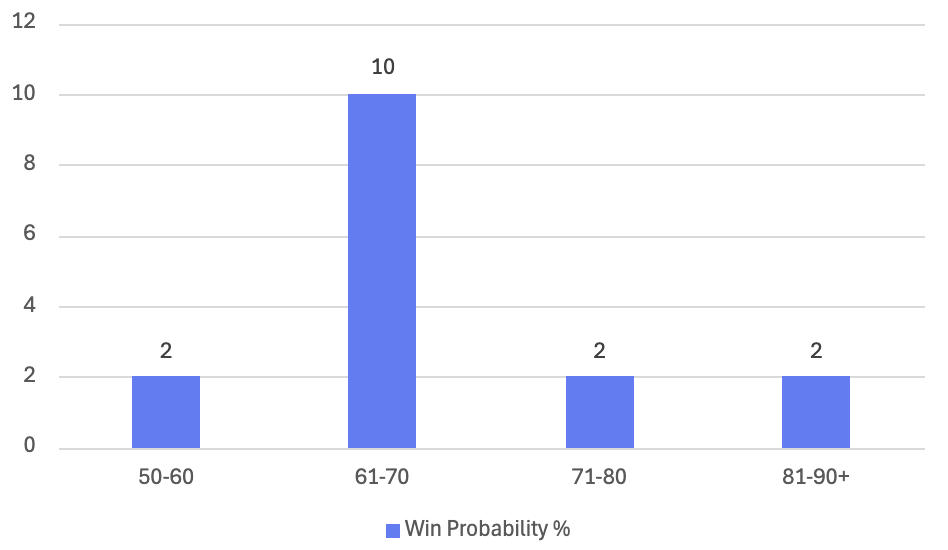
Win Probability | Wins | Losses |
|---|---|---|
50%-60% | 1 | 1 |
61%-70% | 8 | 2 |
71%-80% | 1 | 1 |
80%+ | 2 | 0 |
Total | 12 | 4 |
Week 1 we only had 2 Games that had team’s with a win probability of 50%-60%, which is not a huge sample size so we did not look too much further into this. A mistake now in retrospect.
Week 2 (14-2) Win Probability Distribution
We went 87.5% Week 2 with our picks, an absolutely awesome week that rewarded a ton of our followers. Out of the 16 games, 13 games had a team with a win probability of 60% or higher. Lets break down how these turned out.
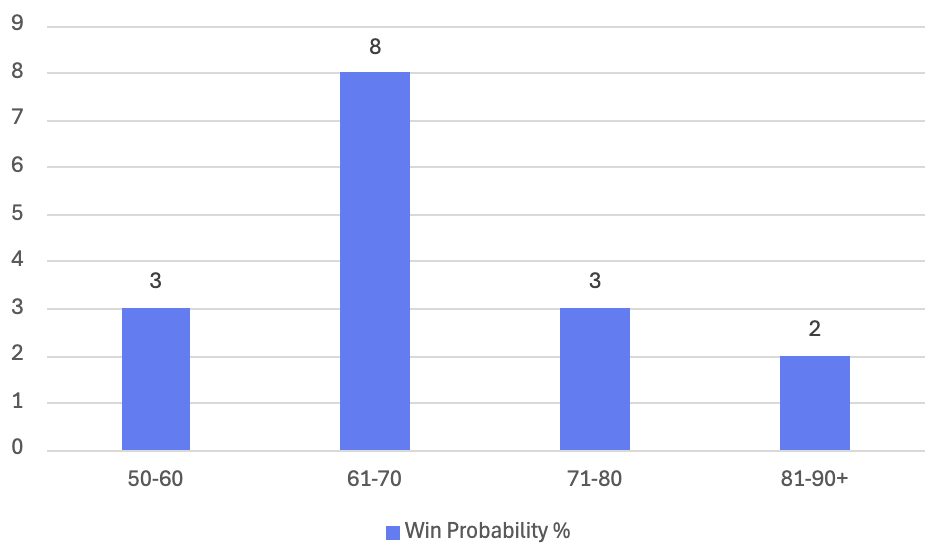
Win Probability | Wins | Losses |
|---|---|---|
50%-60% | 2 | 1 |
61%-70% | 7 | 1 |
71%-80% | 3 | 0 |
80%+ | 2 | 0 |
Total | 14 | 2 |
Again, very low count of teams with a Win probability between 50% and 60%, only 3, and out of that 3, we got 2 right, so no major red flags analyzing these as we need losers to find where our weakness is, when we have so few its hard to identify. But thankfully there is week 3.
Week 3 (7-7-2) Win Probability Distribution
We hit 50% for week 3, with a omitted picks for the Vikings vs Bengals game and Commanders game. When a starting QB gets injured, we omit the pick as the data used for projection assumes the starting QB (Joe Burrow & Jayden Daniels) is going to be the QB. Due to his injury, we mark this in the app and warn users against betting this game.
Out of the 16 games, only 9 games had a team with a win probability of 60% or higher. Lets break down how these turned out.
Win Probability | Wins | Losses |
|---|---|---|
50%-60% | 2 | 4* |
61%-70% | 2 | 1 |
71%-80% | 1 | 1 |
80%+ | 2 | 1** |
Total | 7 | 7 |
*Omitted Washington & Raiders Game & **Bengals vs Vikings Game - Due to Key Injury
The main difference between Weeks 1 & 2? The number of games with 50-60% Win Probabilities, only 5 in total those weeks. Week 3? We had 7. From those 7 games, 6 predictions, 4 losses, 2 wins, 1 omission.
If you did not bet any of the games with 50% - 60% probability of team winning last week, and didn’t bet on a Joe Burrow-less Bengals. You would have gone 5-3.
Is that good? No, but if you did that all of the three weeks, you would be at 28-7 on the year.
So lets sum up the first 3 weeks by win probability in this table.
Weeks 1-3 Winnings by Probability
Win Probability | Wins | Losses | Win % |
|---|---|---|---|
50%-60% | 5 | 6* | 45% |
61%-70% | 17 | 4 | 80% |
71%-80% | 5 | 2 | 71% |
80%+ | 6 | 1** | 85.7% |
Total | 33 | 13** | 71.7% |
*Commanders Raiders & **Bengals vs Vikings Omitted Week 3
Now what have we learned? Games with with probability of 50-60% should be taken with a much more of a grain of salt. Week 3 was a reality check, and when a key player such as Burrow is hurt and we have them favored, do not bet that game, we certainly don’t.
However when we have games with a 50-60% win probability, this is also good time to look @ the ML lines to see if there is value taking the under dog if the probability does not favor the favorite enough.
O/U Projections and How to bet them in PreSnap
We released O/U projections, if you compare the projection to the line, see if its over or under the current O/U line for the game, we are 63% in the last two weeks, 20/32.
For example, Detroit vs Baltimore last night, O/U was 51.5 - we projected 58, the final total was 68 and we got another winner.
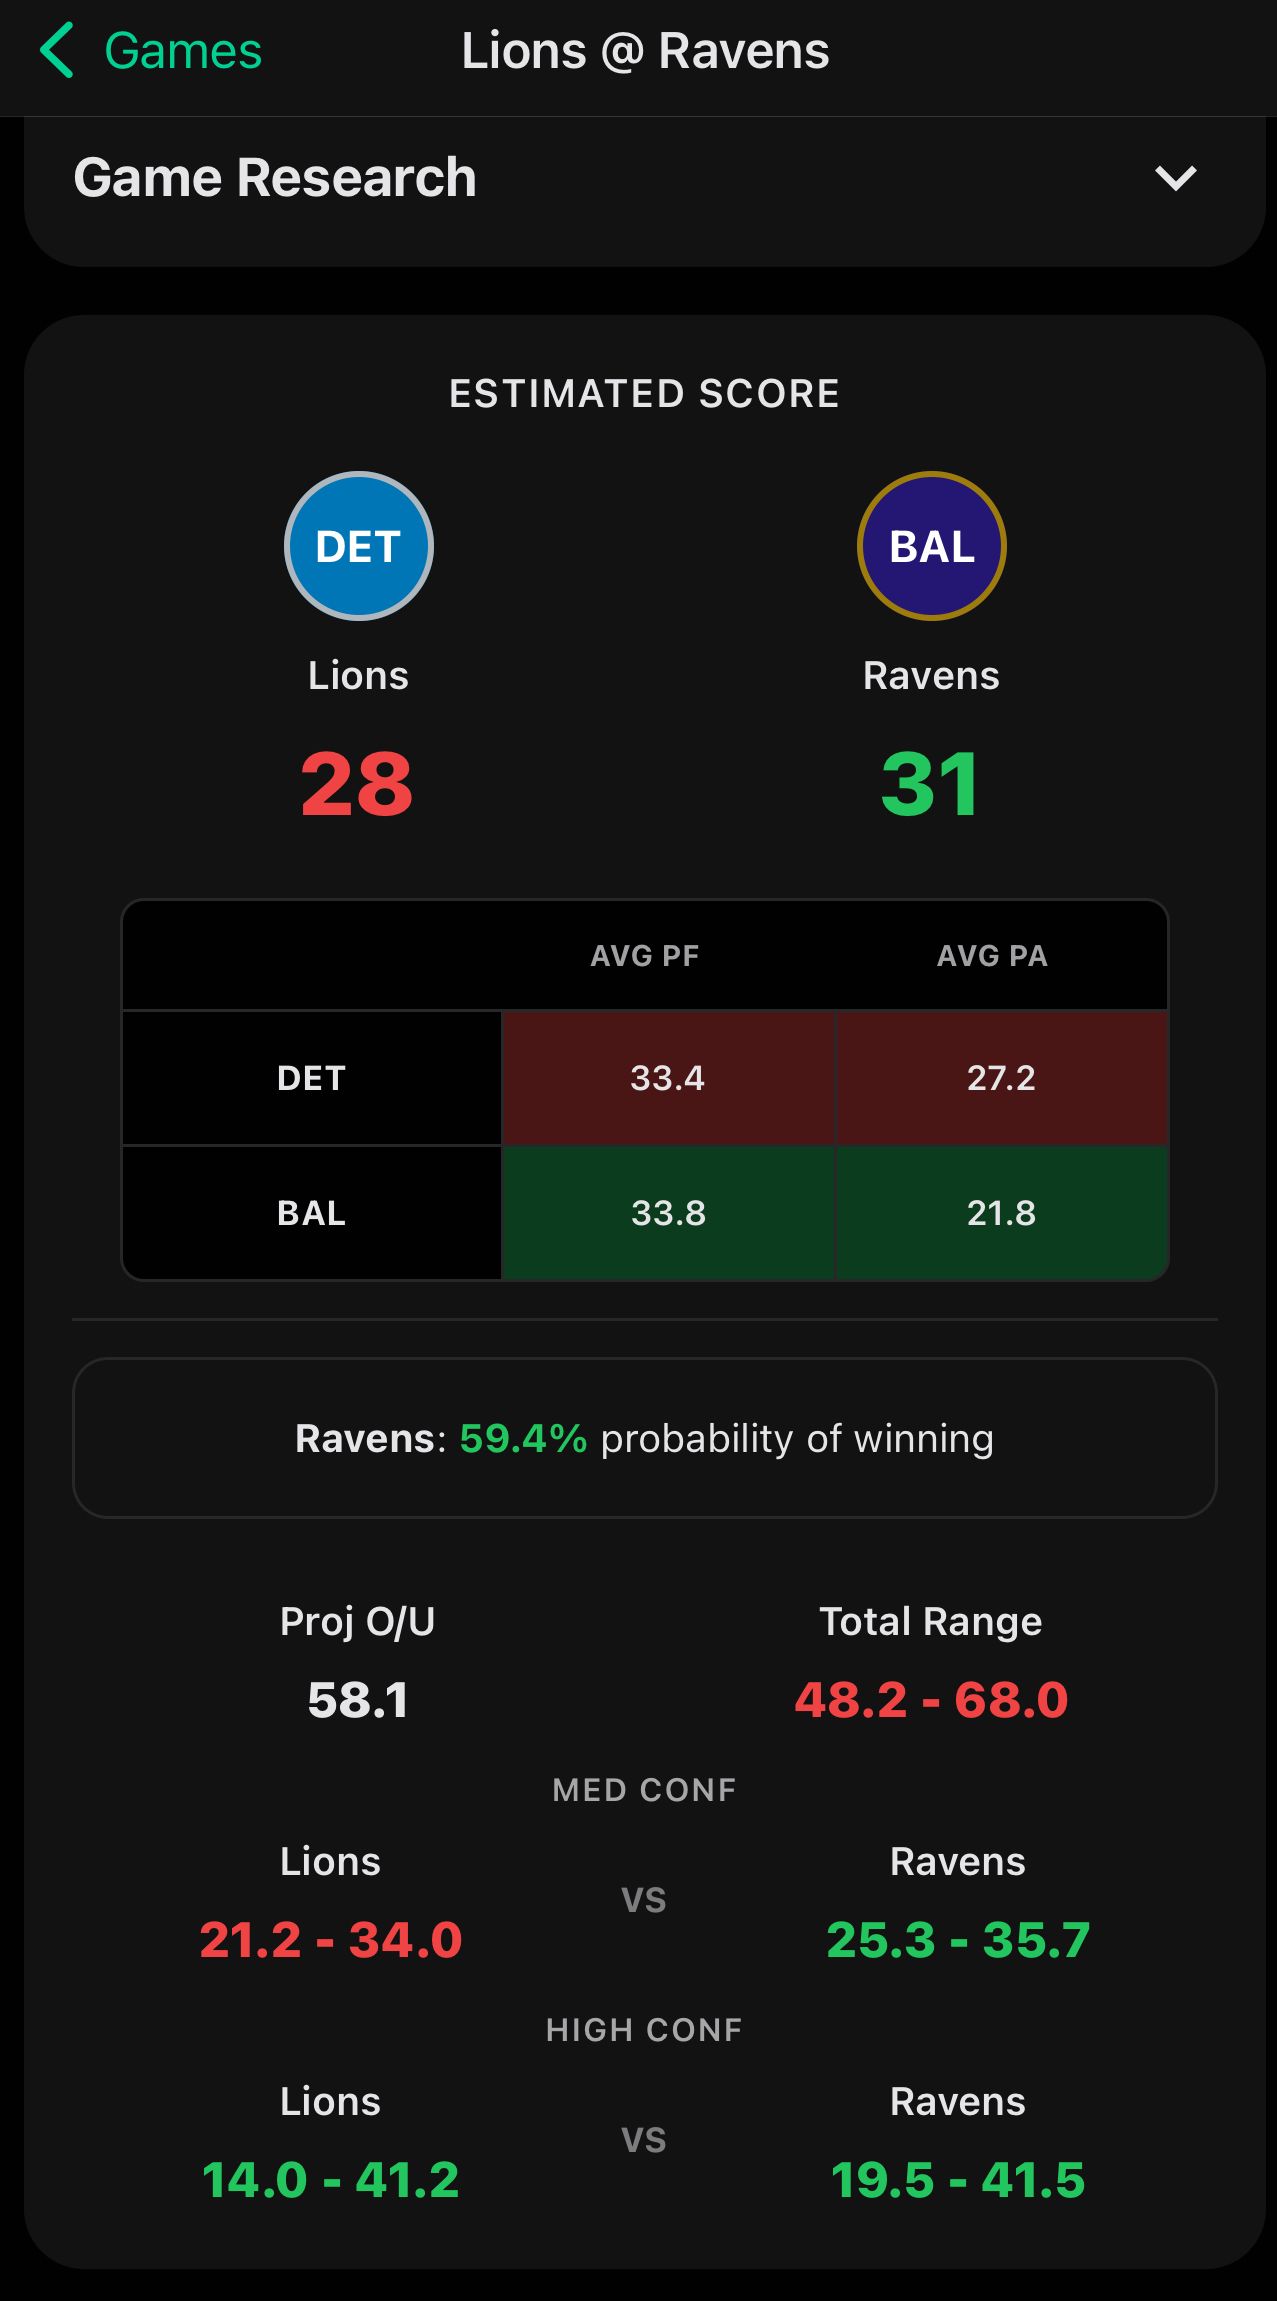
We also had plenty of close point projections for teams last week within 1 point week 3.
Team | Projected | Score |
|---|---|---|
Dolphins | 22 | 21 |
Steelers | 22 | 21 |
Buccaneers | 28 | 29 |
Raiders | 23 | 24 |
Broncos | 21 | 20 |
Chargers | 24 | 23 |
Ravens | 31 | 30 |
Now.. The question you must be wondering.. if you were able to idenifty through the win probabilities that Week 3 was going to be choppy before the games due to win probability, how is week 4 looking?
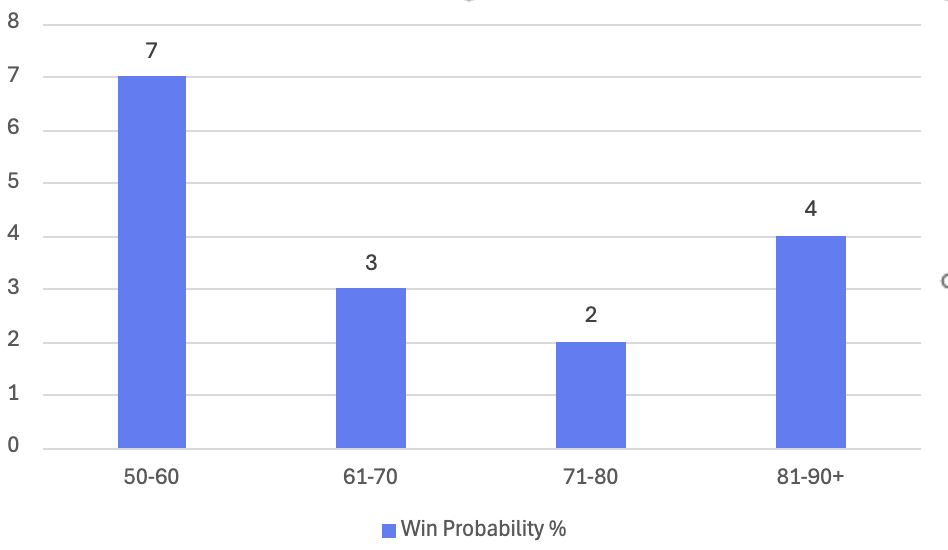
Week 4 Win Probability Distribution
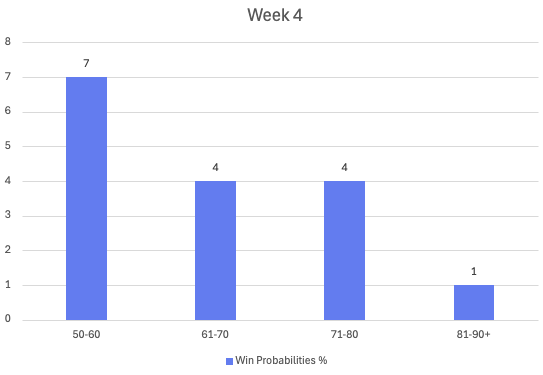
There we have it, Week 4 we have another 7 Games with win probabilities between 50-60%, what does that mean? Tread lightly with those games, look at the value of the underdogs given the probabilities game by game.
The win probabilities are a must have tool for determining confidence in these picks. We provide Three for free but Upgrading your app to PRO will help you bet smarter and with more confidence.
We will also add more detailed breakdowns and projections into the game research of the app this week.
We had a stellar first 2 weeks, and a bumpy Week 3, heading to a Week 4 that warrants better risk mitigation and betting strategy.
And as a reminder - Week 6 is when we release our proven models that are much more accurate and only use the relevant data from this season to improve accuracy.
We are going to be posting 3 Newsletters every week going forward to improve transparency and help our followers bet smarter with our insight. 2 Free Newsletters and a Pro Newsletter each Week. Our free picks Newsletter is SUBSCRIBER ONLY - coming tomorrow.
The Pro Edition of the Newsletter will have all of our pre-game analysis and point ranges that come with the pro version of the app. You can get them via our newsletter or by buying the Pro version of the iOS app.